A Brief History of Time: from Microsoft TTD to malware analysis⏱️ 🔗
At Airbus CERT, we love to fly though time ✈️ 🔗
With the successful release of ttddbg, the Airbus CERT team understood the potential of Microsoft Time Travel Debugging (TTD) for security purposes. Hence, as an intern for five months at Airbus CERT, I have continued to dig into this topic to discover what other secrets could be hiding through time.
🏎️TLDR💨:
You will find in this blog:
- A Windows driver to track child process during TTD recording (Github)
- My research on TTD anti-debug techniques (Github)
- Use YARA rules on Time Travel Debugging traces (Github)
- A Windows Minidump extractor for TTD traces (Github)
- Ideas to improve capa with dynamic feature analysis thanks to TTD
- A prototype to automate TTD recording in AWS instances (Github)
A little travel back in time: Microsoft Time Travel Debugging 🔗
Time Travel Debugging - or TTD - is a feature of the native Windows debugger WinDbg.
It allows you to capture a trace of a process during its execution and to store the result in a trace file. The most famous use cases are:
- Replay the trace with the same execution context
- Replay forward and backwards a trace
- Share a recorded session easily without worrying about reproducing the bug
The security community quickly started adopting TTD for bug hunting. The killer feature that allows going backwards in a debugger is handy for finding bug sources in a binary.

In the malware analysis field, TTD had a smaller impact, even if its potential is huge! Here are a few ideas:
- Use TTD as a sandbox to record malware behaviour
- Record malware execution in a trace file and then analyze this file with classical static tools
- Use TTD to bypass anti-debug techniques
Of course, TTD is proprietary software, which implies two things:
- This work could not exist without ttd-bindings. A huge thanks to @commial, the main contributor to this project 🙏
- Secondly, this project supports Windows only 🪟 (for now) because it needs to use the TTD dll to replay traces. As a former avid Linux user, I had to grin and bear it 🥲
It is worth mentioning that in the middle of my internship, Microsoft released a significant update of TTD. First, they announced the end of the preview period and then released a TTD.exe command line utility. Thanks to it, automation is now more straightforward!
Trace child processes: TTDProcessTracker 🔗
At the beginning of my internship, there was no way to record a child process because the TTD.exe command line utility wasn’t released. In WinDbg, the feature was disabled, probably because it wasn’t implemented yet. However, many samples I am dealing with create new child processes and recording with TTD was a pain.

That’s why I decided to develop the feature by myself! The goal was to create a Windows driver that could trace a PID and suspend any child processes created by this PID. Then, the driver informs the client that a new child was suspended, and the client attaches TTD to this new PID. Finally, the client resumes the new child process!
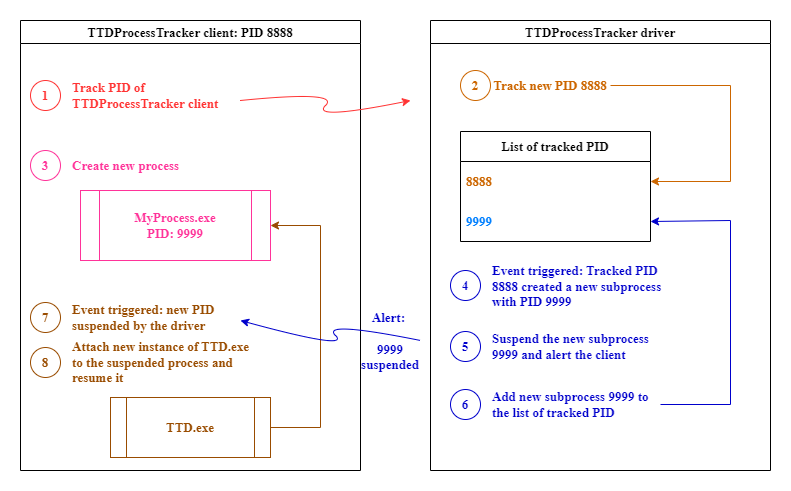
Of course, in the middle of the project, Microsoft released its TTD.exe command line utility, and my project became useless… 🥲 Of course, it didn’t because it was my first experience with Windows drivers, and I learnt a lot! ⚙️
I still released the source code of the project for fun and profit! You can check it out at TTDProcessTracker.

TTD detection: anti-ttd 🔗
Once I finished the development of TTDProcessTracker, I tried to test it on the pyarmor packer. This packer creates a temp folder with all the required DLLs and restarts the process within this directory.
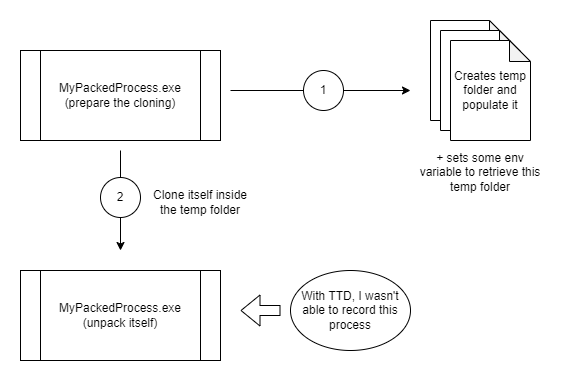
I packed a simple “Hello World” Python script and tried to run TTDProcessTracker on it, and … it failed. Actually, it didn’t really fail because I could record both the original and newly created process, but the second one crashed before printing “Hello, World!”. I was probably facing an anti-debug trick that could detect TTD.
That’s why I decided to create anti-ttd, a research project to test all the existing anti-debug techniques on TTD to see how I could block/hide it.
I used unprotect.it to get a good start on well-known anti-debug techniques and noticed that most of these classical tricks don’t work on TTD because it isn’t real debugger.
When recording a process with TTD, a DLL is injected into the process and records the process in a .run file. Hence, I also designed several TTD specific anti-debug techniques:
👪 Parent process: Check if the parent process is ttd.exe. It can be bypassed if the ttd.exe binary is renamed.
🧩 DLL detection: Scan the DLL loaded and search for TTDRecord.dll. It can be bypassed if the DLL is renamed.
📂 Open handles: Scan the handles opened by the process and search for .run files. If the current process is recorded by ttd.exe, it will automatically record the data into a .run file.
🔎 Note:
Even if I learned a lot with anti-ttd, I still have no idea how pyarmor defeats TTD. Even with the official release of Windows TTD.exe command line utility and its child-tracking feature, I cannot record this pyarmor sample. Curiously, I did record properly 2 times the binary with TTDProcessTracker (it was fully random), but I didn’t investigate yet on the traces. I created an issue on the anti-ttd repo with all the information.
The ultimate packer nemesis: yara-ttd 🔗
📽️ Note:
Watch yara-ttd introduction during my rump at SSTIC 2023 (🥐 french only 🥐)
YARA is a powerful pattern-matching tool for binaries. Thanks to YARA, we can save much time by automatically classifying malware samples in a pipeline before analyzing them.
YARA is a tool aimed at (but not limited to) helping malware researchers to identify and classify malware samples. With YARA, you can create descriptions of malware families (or whatever you want to describe) based on textual or binary patterns.
Unfortunately, most malware samples are protected with different kinds of packers. A classical runtime-packer scheme like UPX or VMProtect consists of self-extracting and running obfuscated and sometimes encrypted code. Therefore, YARA cannot deal with packed binaries because it won’t find matches in the packed code.
💡 The idea behind yara-ttd is to use the trace files recorded by TTD with yara itself to defeat packers.
Because yara cannot scan the packed binary itself, yara-ttd provides a way to analyze the trace file that contains all the runtime information, including the unpacking process. With yara-ttd, you can select a set of positions in the trace file to scan the memory with your yara rules. Hence, you can hook the packed binary wherever you want with your yara rules!
yara-ttd provides several memory scanning strategies, like loaded module memory and virtual memory allocation.
A binary packed with UPX 🔗
A simple binary that launches calc.exe, packed with UPX.
yara-ttd finds the calc.exe string in the module memory during thread creation.
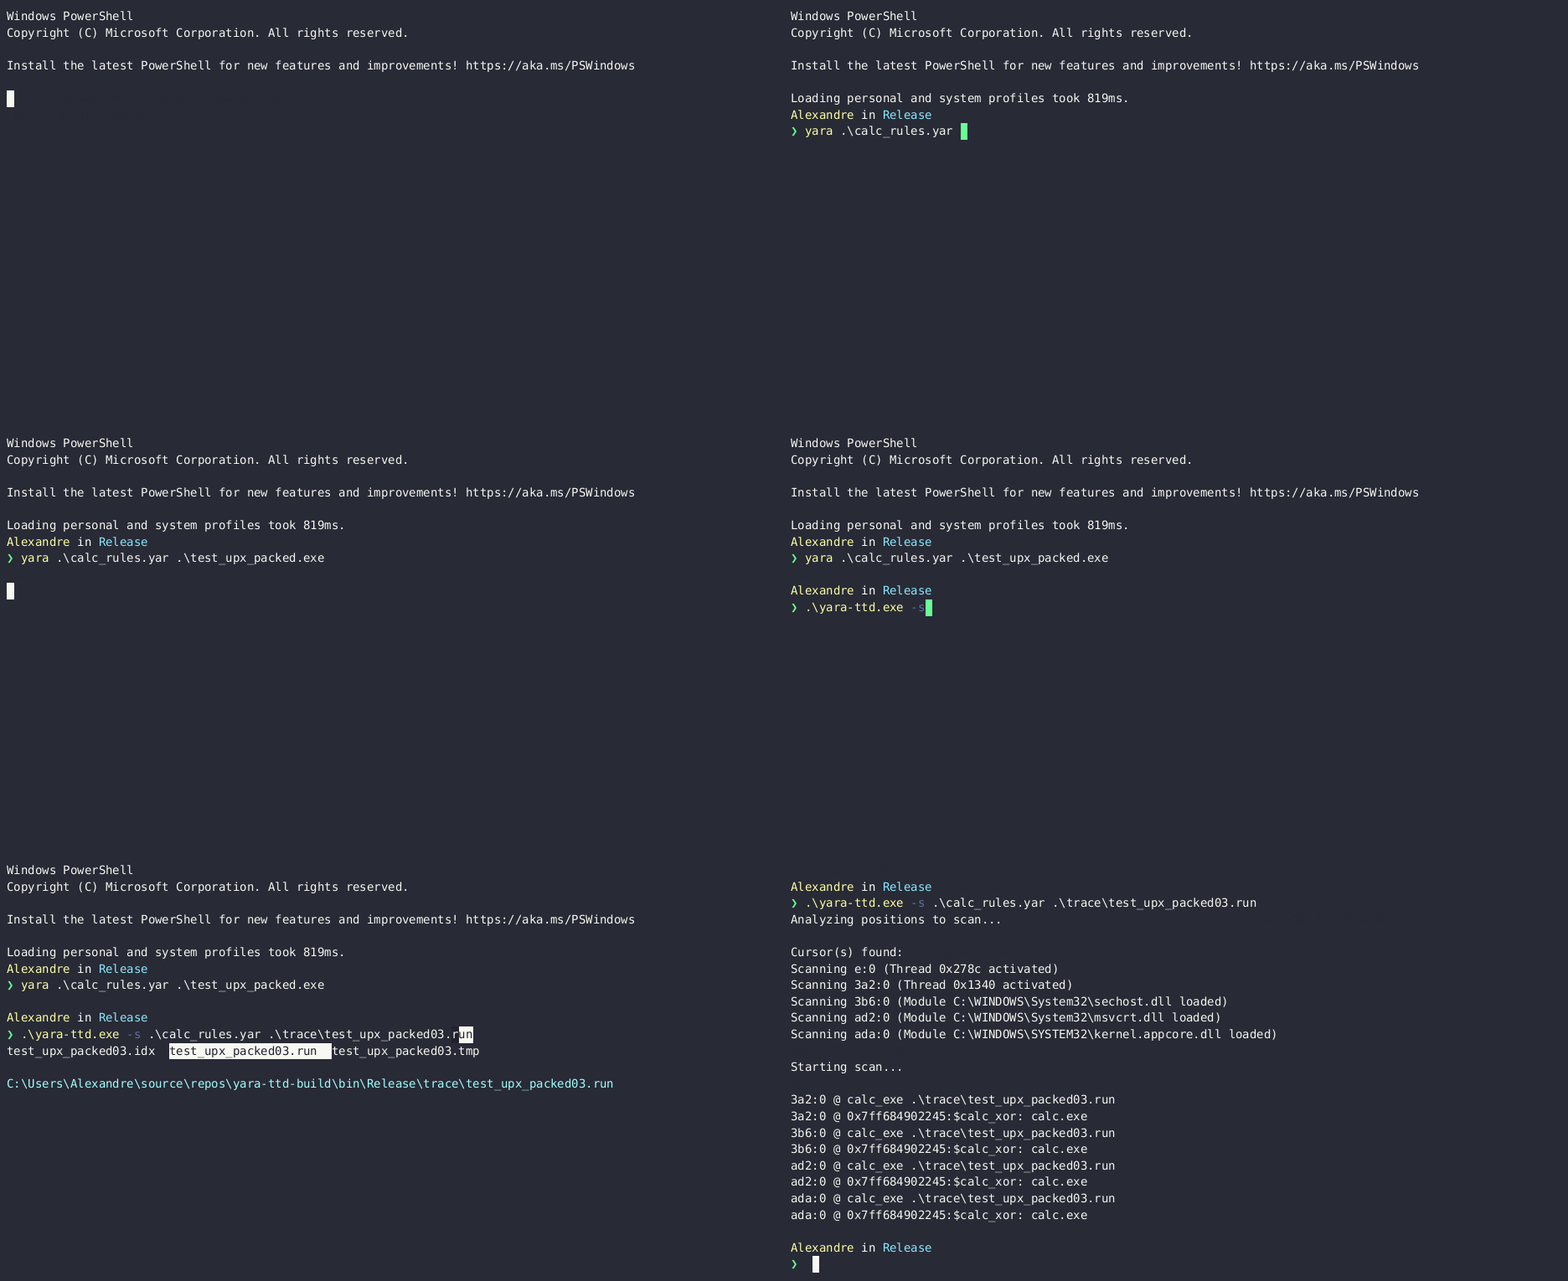
An obfuscated shellcode that runs calc.exe 🔗
The tested binary decrypts a shellcode and runs it in a new thread.
yara-ttd finds the calc.exe string on the heap when hooking on the ntdll!NtCreateThreadEx function.
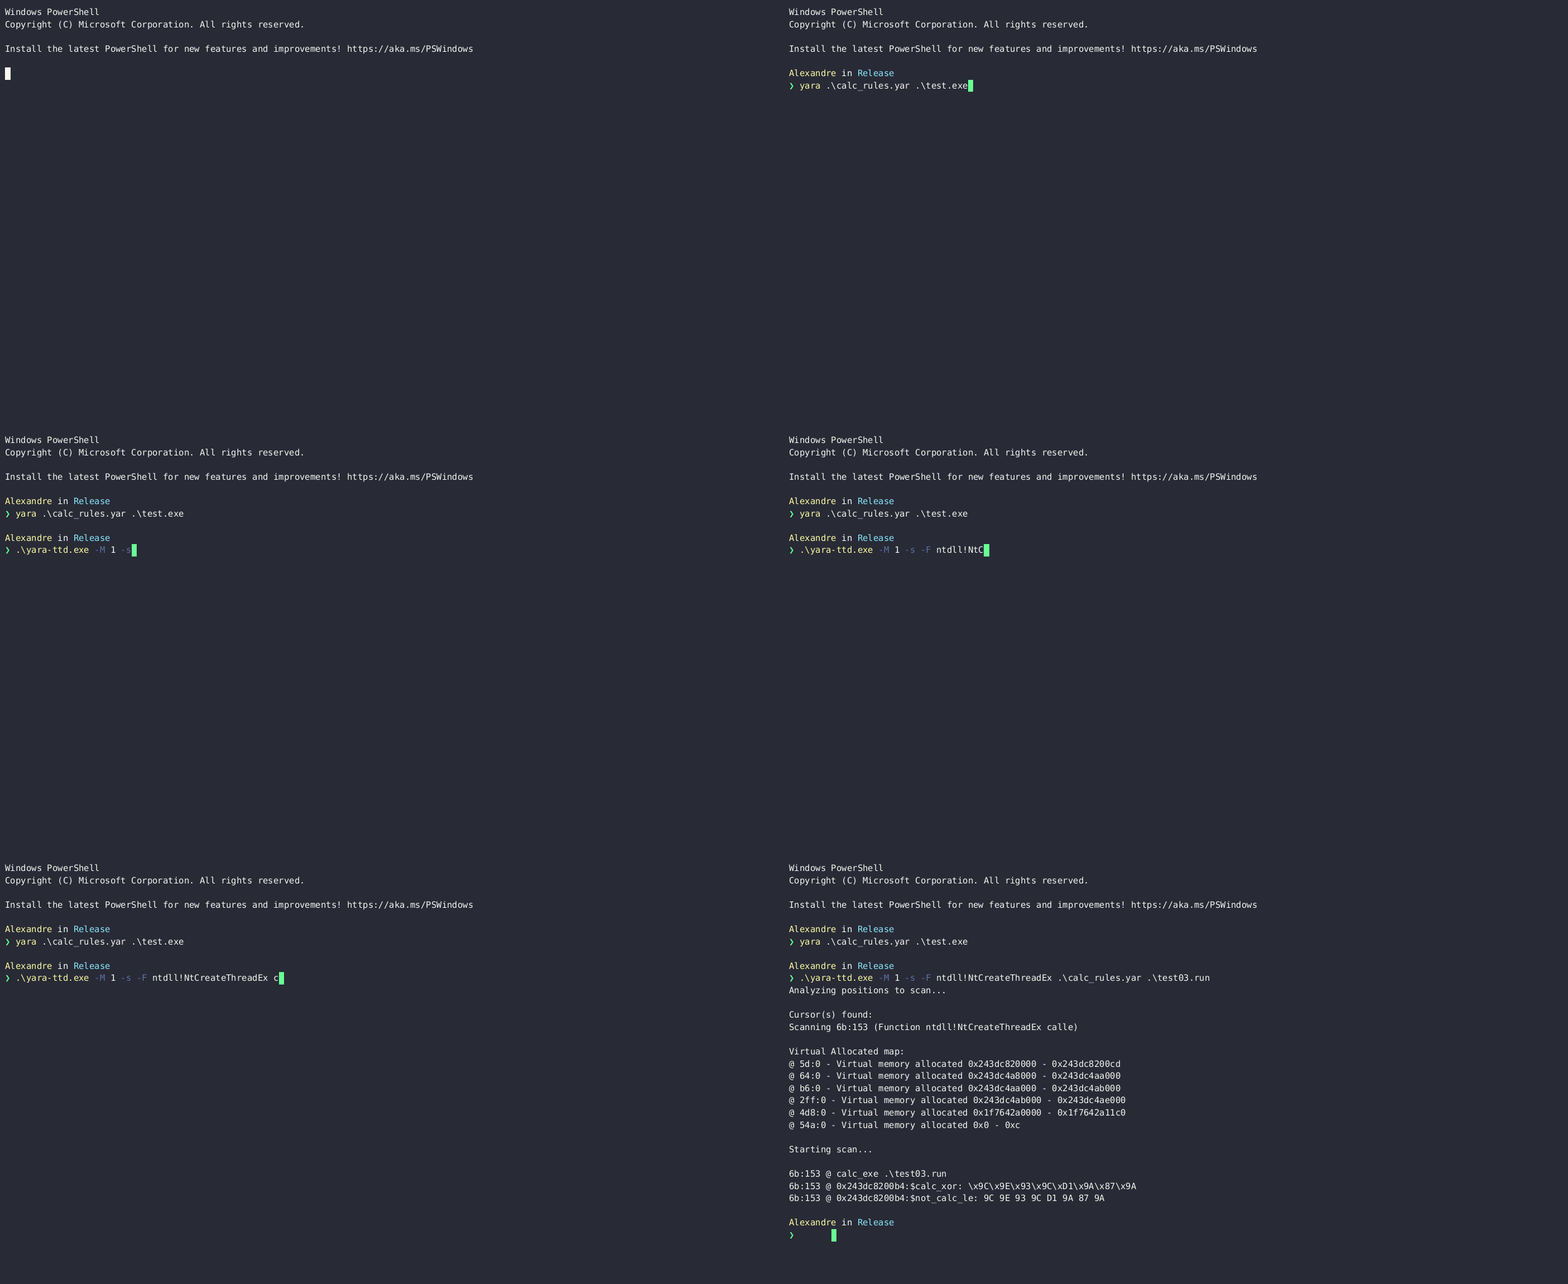
Extract my TTD trace: ttd2mdmp 🔗
During a chat with the capa team from Mandiant, I discovered Windows Minidumps. They are usually used to save a context during a crash. They store partial information about registers, memory, threads, and systems…
There are many previous works on Minidumps analysis compared to TTD trace, and that’s why I started to build ttd2mdmp, a tool to extract a Minidump from a TTD trace.
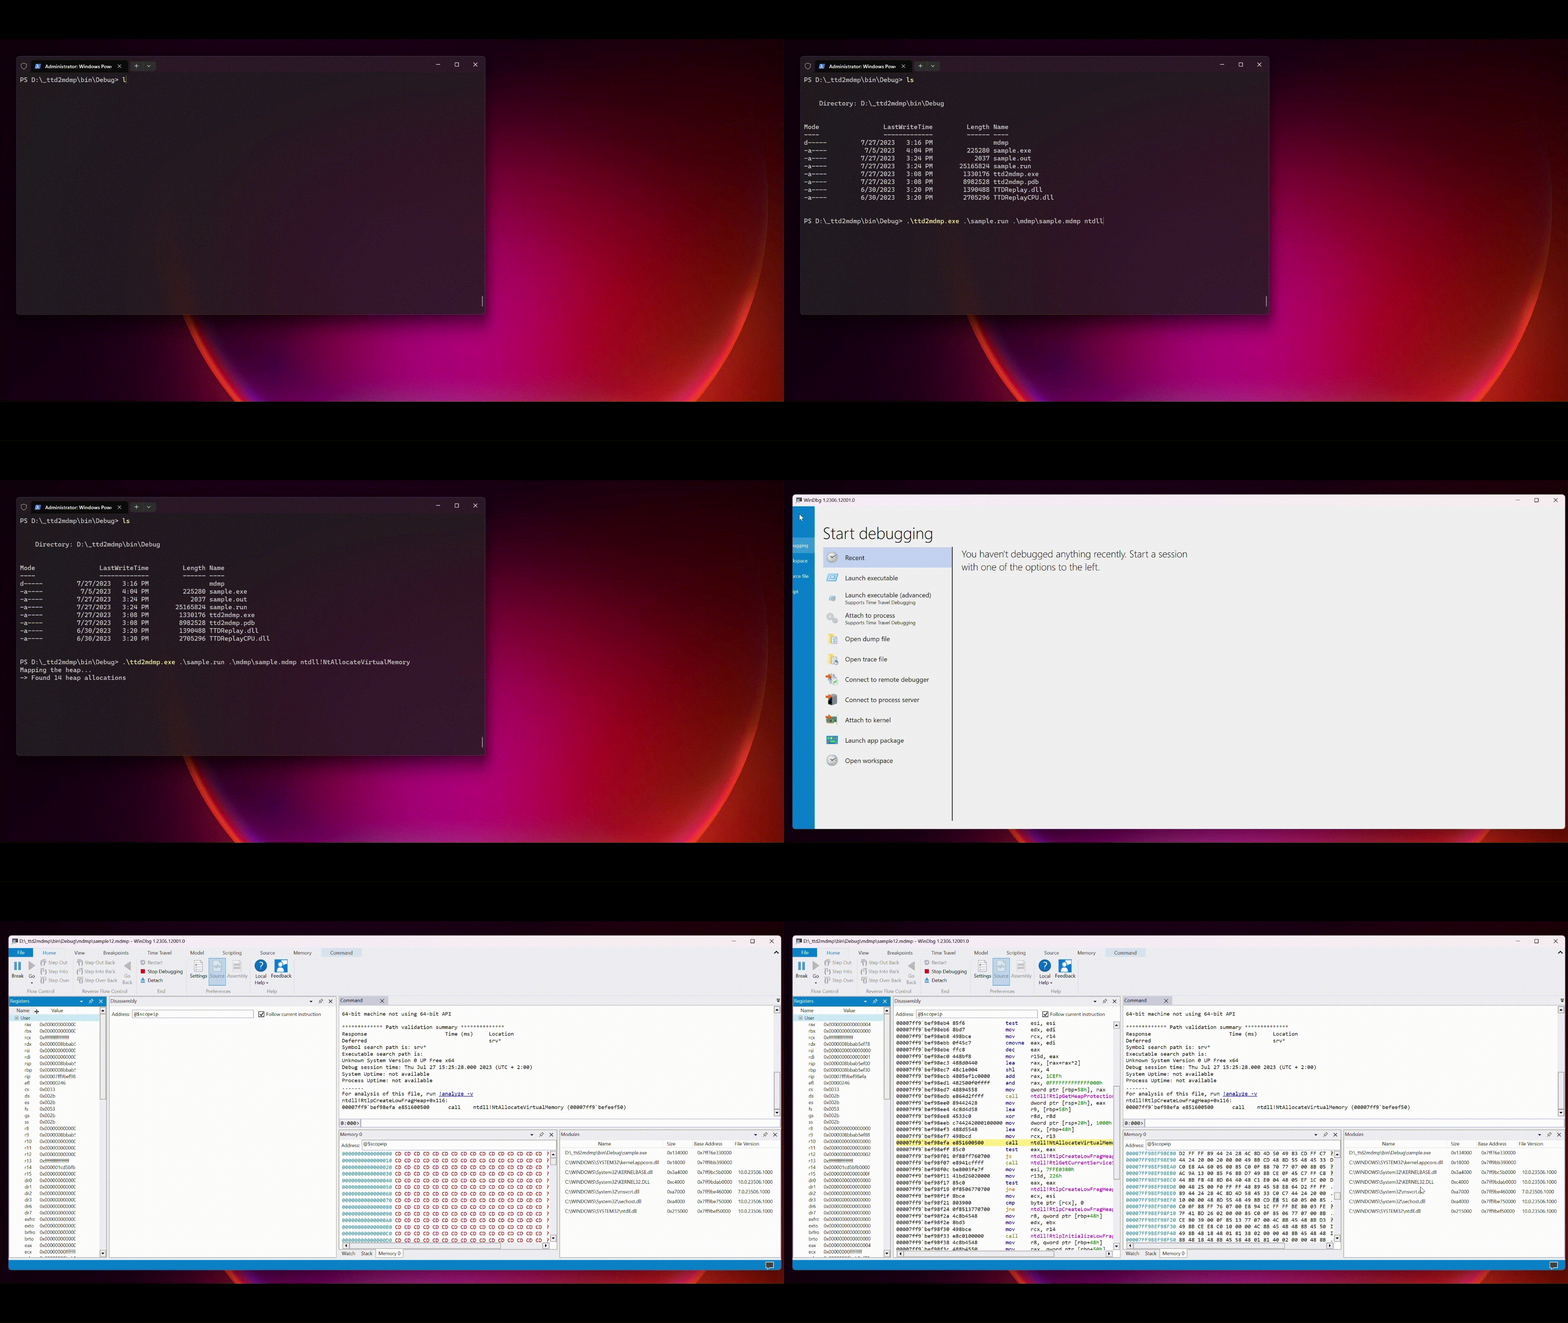
As for yara-ttd, you must choose a time position to generate the Minidump. This can be done either with a TTD time position or with a function hook, which will extract as many Minidumps as hooks.
Thanks to ttd2mdmp, you can extract the following data:
🧵 Threads:
- Thread id
- Thread stack range
- Thread stack
- Thread context
- TEB
🧩 Modules:
- Module name
- Module memory range
- Module memory
📑 Heap
- Heap ranges generated by tracing ntdll!NtAllocateVirtualMemory calls
- Heap memory
⚙️ System Information
- Processor architecture
Dynamic feature analysis: capa & TTD 🔗
After the first release of yara-ttd, I started to talk with the capa team from Mandiant. One of the ideas they released for the Google Summer of Code 2023 was adding dynamic feature analysis.
Two usages of TTD and capa were highlighted during the discussion:
📄 Run capa on TTD trace files:
The idea could be to use TTD as a sandbox to extract API calls, strings, memory dumps, register context… Currently, capa is starting to add dynamic features with CAPE. After the release of this new feature, there could also be a TTD version. The entire discussion is available here.
💉 Extract and analyze Minidumps:
First, dump a TTD trace at a given position to generate a Minidump. Thanks to ttd2mdmp, this is now possible. Then, perform an extended static analysis with the Minidump context (thread, memory, register, return address…). The goal is to build a Minidump feature extractor to feed the capa engine. This feature still needs to be implemented; see this issue to stay up to date.
TTD sandbox automation:autottd 🔗
Thanks to all the projects I worked on, I believe TTD could be a massive asset in the security field. However, there is still a blind spot.
At this point, when working on a sample, you need to fire up a Windows virtual machine, install WinDbg, record the trace and then export the trace file to work on it. This process could be faster and prevent us from deploying the TTD tools on an automated pipeline.
That’s why sandbox automation is among the most critical incoming work in this TTD journey.
I started to build autottd, an AWS prototype that would automate the recording of a sample inside an EC2 instance.
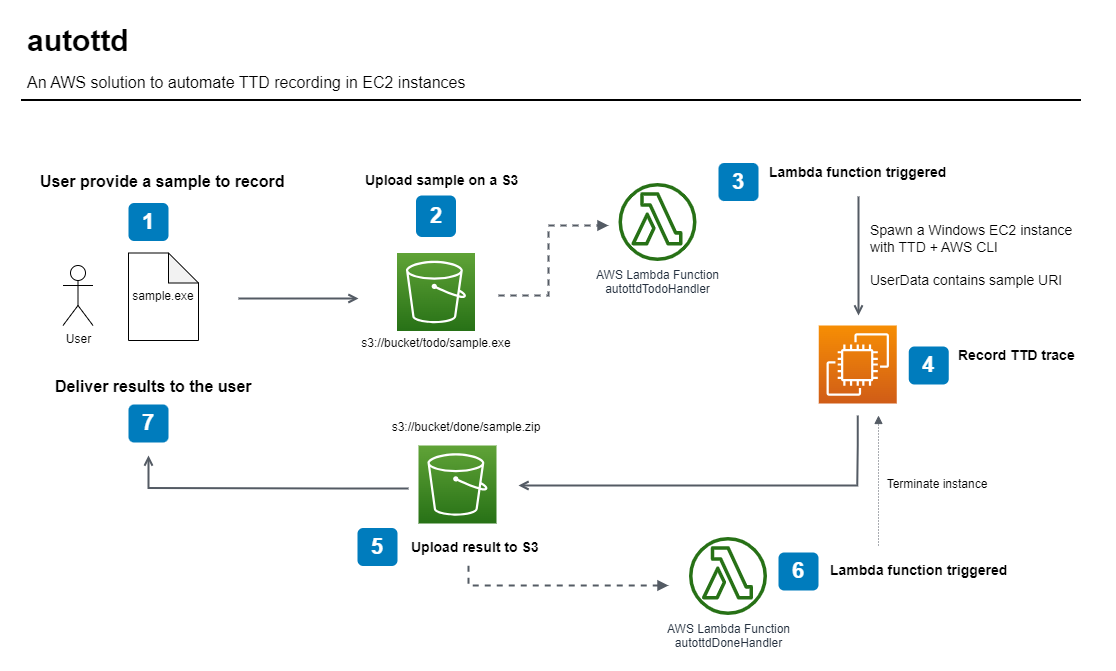
⚠️ Note:
This architecture is still a draft, and might receive some improvement. Checkout the repo to stay up to date!
Conclusion 🔗
I would like to thanks the CERT team for welcoming me during this wonderful internship, especially Sylvain Peyrefitte, my tutor, who was the mind behind most of these project ideas 💡
Repos: 🔗
- 🕵️ TTDProcessTracker
- 🐞 anti-ttd
- 🔎 yara-ttd
- 📝 ttd2mdmp
- ⚙️ autottd